The platform mainly comprises of the Dashboard and the System.
The “System” page can be used to test a strategy by either creating a new system or editing an existing one. After
necessary options are selected, the user is presented with the results of a test of that system on real past matches. This
test, for all reference purposes called backtesting, is performed to simulate the behavior of the system in daily
operation and the expected results.

The “Dashboard” page can be used to provide an overview of existing systems and any resulting picks that indicate suitable cases of future matches, produced by the user’s active systems. With users able to explore different strategies at the same time, this page allows control over the collection of the user’s saved systems.
Select “Create new system” from the dashboard. First step is the leagues selection. Although you can select up to five leagues, it is preferable to use the algorithm based on one league.
Coupled with league selection, a selection of seasons has to be made, in order to lead to a database of football matches. At this point, users select how far back in the past should be the samples of matches, which the system is going to use, to create suitable predictions about the future. With a great number of matches available, users can select up to 10 seasons in the past.
The market selection is the target of the system and any simulations and testing of the system will consider this market alone. The users can select from a collection of markets, representing the most famous ones.
Features are the basic data than machine learning will consider for training the model. With the meaning training we mean the procedure for the model to learn and find patterns how to predict the target market. So, in general features must be correlated with the target market and better choice of features results in better predictions.
There are two types of features in futbolbrain, statistics and odds features.
Statistics features menu is provided with a number of different statistics that can be used for either the home or away (or both) team. Users can select what they consider to be the most important and relevant features that can determine best a specific outcome.
The options for statistics features are grouped under categories, where:
• Simple Statistics: Average values based on sample size of prior games as obtained for each team. This can include shots on goal, dangerous attacks etc.
• Composite Statistics: Average values based on sample size of prior games. This can include goals scored by team only at same position, dangerous attacks by goals ratio, wins etc.
• Streak: The formula concerning streaks is the plain number of consecutive matches the streak has been going for. The matches in that sample are the ones the team has appeared either as Home or as Away. Values include the average of the corresponding steak statistics based on sample size of prior games.
Detailed description of the statistical features in Appendix A.
Having already chosen statistic features you must select the form, meaning the number of previous matches used to calculate the statistics per match. Since users might for example assume that only the past five matches are important in determining the outcome of the next, this gives them the option to adjust the depth of the statistics on the fly. There is one selection for statistic form and one for streak one.
Apart from the statistics features, there is also an option to add features including odds prices from game markets. There, users simply select the markets that they wish to include and the respective odds offered by book makers are used as features to make predictions.
After all the above selections have been made, a machine learning model can be trained to make predictions for possible events of the target market. In order to train and test such a model, a train/test split of the dataset is created in a ratio of 70% / 30% respectively.
The model will be trained for machine learning using the train set, while the test set is kept for testing the predictions of the model. More information about machine learning process in methodology. Press the button “Train now” to train the model.
Train the model. Get the predictions on test dataset finding success rate. Backtest the predictions of test dataset to get yield and profit / loss. Take games picks for future games.
Machine learning model trained the train set and then tested the predictions on the test dataset. When the prediction probability of the target, in every match of the test set, is higher than the reliability threshold being used (default of 0.5 or 50%), the model assumed that the target outcome was the most possible event.
Subsequently, since the results of matches in the test set are already known, the ratio of correctly and falsely predicted matches is displayed. This provides a first look into how well the model generally fairs in detecting the desired outcome beforehand.
Predicted games: Are the games of the test set that the target outcome was probable to win according to the model, meaning that the probability of success of the target market is bigger than reability value.
Correct / False predictions: Since the results of the matches are already known the model display the correct and the false predictions.
Success Rate: Is “correct predictions”/ “false predictions”
Reability (threshold): Is the reference value to predict an event or not. When a probability of an outcome is bigger than the reability value then this outcome predicted “Yes”. If the probability is less then the outcome predicted “No”. Default value is 0.5 (50%).


Another important part of the results is the innate relationship between the different features and the respective importance assigned to them by the machine learning model, after training. This information can be invaluable in data mining why a system either succeeds or fails to produce a lucrative strategy and what features played a major role in leading to that.
The respective view where this information is provided is show, with the bars representing the relative importance of the features, adjusted as per the best-scoring one. Iterating using these findings, a user can select to improve the performance of the system by removing a poorly-performing feature or add a new one to examine how the balance between the new and the old features is affected.
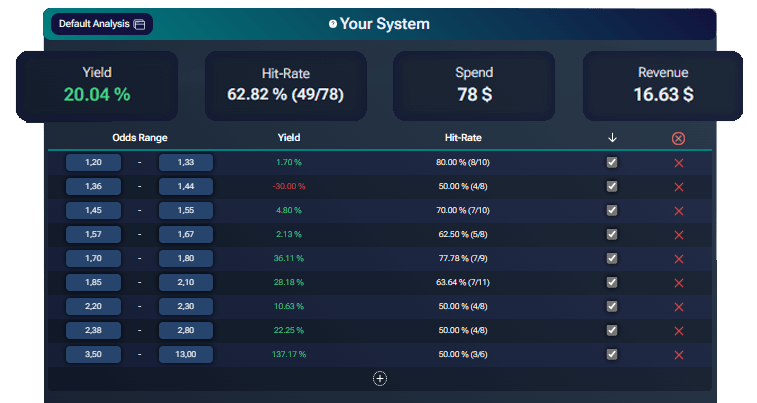
Additionally to the training model a backtesting process is carried out to measure the profitability of any given system. By using the target market and book maker odds prices a simulation is carried out using a simple 1 point stake.
Specifically, the corresponding results view contains the following information:
Odds analysis table allows users to better understand profitability in different odds areas, which inversely indicate different probabilities for the result. As an added functionality, users can filter by these ranges, either by activating/disabling or creating new ones completely. This functionality allows for better control over what is being used and adjusting for profit.

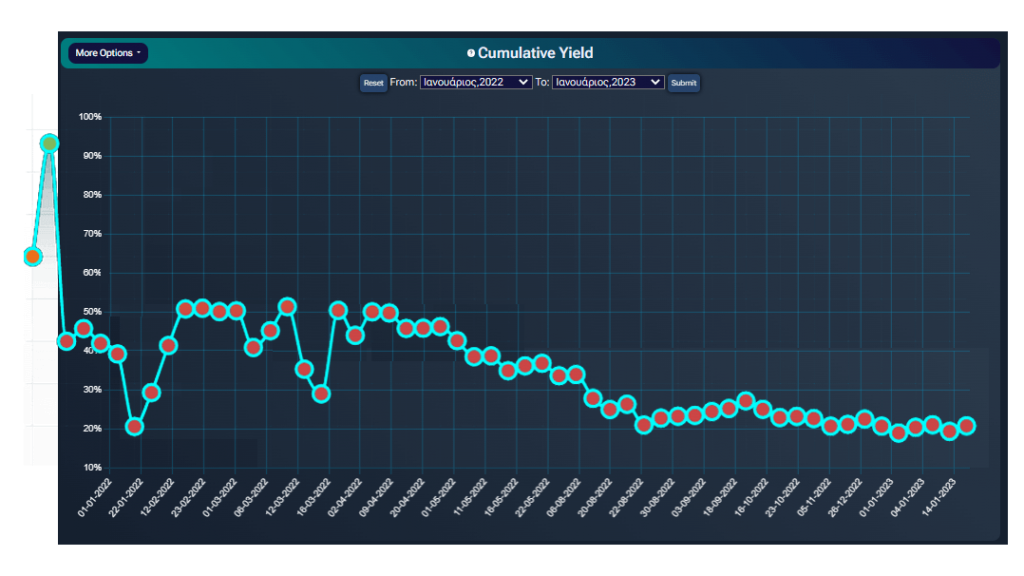
In a similar manner, a cumulative yield graph over the time period that the matches used for backtesting is displayed. This presents with a progressive view of how the system performed over time and can be a good indication of its stability and any trends or patterns that may arise.
An extra functionality here, regards selecting any subset of the provided date range so that more attention can be given to areas that provide interesting observations or just need a closer look.

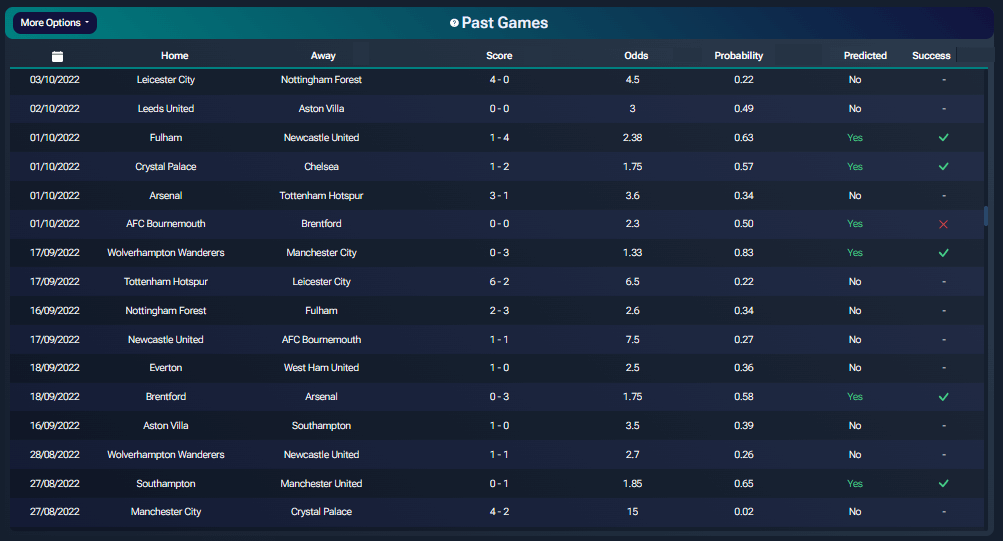
The whole games of test dataset are presented, displaying details of dates, score and book
maker odds of the selected target market.
Additional to that, there is an information from
machine learning procedure which are:
Probability: The calculated probability from machine learning algorithm
Predicted: “Yes” or “No”. If probability is bigger than reability value then the prediction for
that game is “Yes”, else it is “No”.
Success: “true” or “false”. Compared to the real (past) results if the predicted games
(predicted “Yes” ) are correct, the display is true, else is false.

Finally, perhaps the most important output of the system after analysis has taken place, are indicating any suitable
future matches. The corresponding picks area, provides with such information, with ideal matches being presented
together with the probability of the target outcome (as calculated by the ML model) and currently offered book maker
odds.
The features below are calculated based on sample size of prior games as obtained for each team. Features can be calculated for “Home” and/or “Away” team.
Goals Scored at same position: Average goals scored by a team when played in the same position, meaning home or away.
Goals Scored: Average numbers of goals scored by a team.
Shots on goal Ratio: Average [shots on goal / goals scored+1]. Used to represent “success of shots on goal”.
Dangerous attacks Ratio: Average [dangerous attacks / goals scored+1]. Used to represent “success of dangerous attacks”.
Wins: Average wins for each team.
Draws: Average draws for each team.
Losses: Average losses for each team.
1. Shots total
2. Shots on goal
3. Shots off goal
4. Shots blocked
5. Shots inside box
6. Shots outside box
7. Passes total
8. Passes accurate
9. Ball safes
10. Attacks total
11. Attacks dangerous
12. Fouls
13. Off sides
14. Corners
15. Possession time
16. Yellow cards
17. Red cards
18. Injuries
19. Yellow red cards
20. Saves
21. Substitutions
22. Goal kicks
23. Goal Attempts
24. Free kicks
25. Throw Ins
26. Ball Safes
27. Injuries
28. Penalties
29. Goals
The calculation formula concerning streaks is the plain number of consecutive matches the streak has been going for. The matches in that sample are the ones the team has appeared either as Home or as Away.
The features below include the average of the corresponding stat (based on sample size of prior games) as obtained for each team. Features can be calculated for “Home” and/or “Away” team.
Win: Consecutive wins for each team.
No Win: Consecutive matches where each team did not win (either lost or drawed).
Loss: Consecutive losses for each team.
No Loss: Consecutive matches where each team did not lose (either won or drawed).
Draw: Consecutive matches where each team drawed .
No Draw: Consecutive matches for each team that did not end in a draw (either won or lost).
Win To Nil: Consecutive matches where each team won without receiving a goal.
Lose To Nil: Consecutive matches where each team lost without scoring a goal.
Failed to score: Consecutive matches where each team failed to score (regardless of the outcome).
Clean Sheet: Consecutive matches for each team where the enemy team did not score a goal.
No Clean Sheet: Consecutive matches for each team where it received at least 1 goal.
Come From Behind: Consecutive matches where at some point the team was losing but ended up winning.